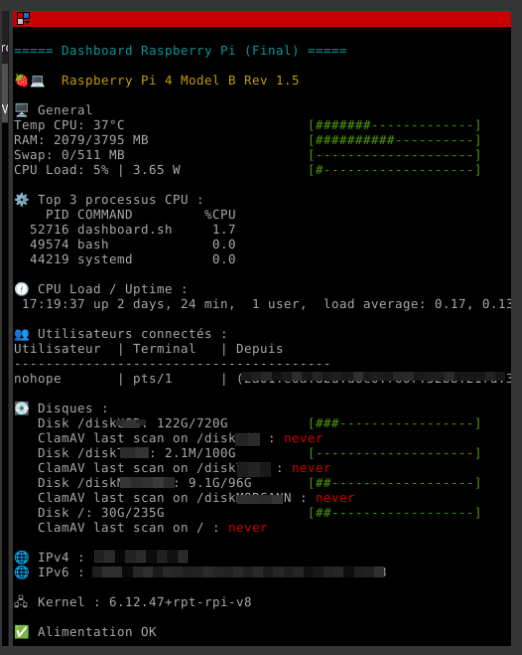
Dashboard Raspberry
Juste un petit tableau de bord de l'état de santé de votre raspberry (perso. un raspberry 4B), mais fonctionnel sur un pi zero et un 5.
- download
#!/bin/bash
# ==========================================
# Dashboard Raspberry Pi complet
# Barres alignées, disques "utilisé/total", utilisateurs
# ==========================================

# --- Couleurs ---
RED="\e[31m"
ORANGE="\e[33m"
GREEN="\e[32m"
CYAN="\e[36m"
RESET="\e[0m"

BAR_LEN=20        # longueur barre
VALUE_COL=35      # colonne fixe pour aligner toutes les barres

# --- Fonction barre ASCII ---
bar() {
    local pct=$1
    local length=$2
    local filled=$((pct * length / 100))
    local empty=$((length - filled))
    local color=$GREEN
    if [ "$pct" -ge 90 ]; then color=$RED
    elif [ "$pct" -ge 70 ]; then color=$ORANGE
    fi
    printf "${color}["
    for ((i=0;i<filled;i++)); do printf "#"; done
    for ((i=0;i<empty;i++)); do printf "-"; done
    printf "]${RESET}\n"
}

# --- Affiche ligne avec barre alignée ---
print_line() {
    local label="$1"
    local value="$2"
    local pct=$3
    local padding=$((VALUE_COL - ${#label} - ${#value}))
    [ $padding -lt 1 ] && padding=1
    printf "%s: %s%*s" "$label" "$value" $padding ""
    bar "$pct" $BAR_LEN
}

# --- CPU load et uptime ---
get_cpu_uptime() {
    echo "🕧 CPU Load / Uptime :"
	uptime
	echo ""
}


# --- Température CPU ---
get_temp() {
    if [ -f /sys/class/thermal/thermal_zone0/temp ]; then
        RAW=$(cat /sys/class/thermal/thermal_zone0/temp)
        TEMP=$(awk "BEGIN {printf \"%.0f\", $RAW/1000}")
        print_line "Temp CPU" "${TEMP}°C" "$TEMP"
    fi
}

# --- RAM / Swap ---
get_memory() {
    MEM_TOTAL=$(free -m | awk '/^Mem:/ {print $2}')
    MEM_USED=$(free -m | awk '/^Mem:/ {print $3}')
    MEM_PCT=$((MEM_USED * 100 / MEM_TOTAL))

    SWAP_TOTAL=$(free -m | awk '/^Swap:/ {print $2}')
    SWAP_USED=$(free -m | awk '/^Swap:/ {print $3}')
    SWAP_PCT=$((SWAP_TOTAL==0 ? 0 : SWAP_USED * 100 / SWAP_TOTAL))

    print_line "RAM" "${MEM_USED}/${MEM_TOTAL} MB" "$MEM_PCT"
    print_line "Swap" "${SWAP_USED}/${SWAP_TOTAL} MB" "$SWAP_PCT"
}

# --- CPU Load + consommation ---
get_cpu_load() {
    read cpu user nice system idle iowait irq softirq steal guest < /proc/stat
    total1=$((user+nice+system+idle+iowait+irq+softirq+steal))
    idle1=$((idle+iowait))
    sleep 0.5
    read cpu user nice system idle iowait irq softirq steal guest < /proc/stat
    total2=$((user+nice+system+idle+iowait+irq+softirq+steal))
    idle2=$((idle+iowait))
    total_diff=$((total2 - total1))
    idle_diff=$((idle2 - idle1))
    CPU_LOAD=$((total_diff==0 ? 0 : (100*(total_diff-idle_diff)/total_diff)))
    power=$(awk -v cpu_load_val=$CPU_LOAD 'BEGIN {printf "%.2f", 3.5 + (cpu_load_val/100)*3}')
    print_line "CPU Load" "${CPU_LOAD}% | ${power} W" "$CPU_LOAD"
}

# --- Top 3 processus CPU ---
top_processes() {
	echo ""
    echo -e "⚙️  Top 3 processus CPU :"
    ps -eo pid,comm,%cpu --sort=-%cpu | head -n 4
    echo ""
}

# --- Disques ---
print_disk_info() {
    MOUNT=$1
    INFO=$(df -h "$MOUNT" 2>/dev/null | tail -1 | awk '{print $1, $2, $3, $4, $5}')
    if [ -n "$INFO" ]; then
        USED=$(echo "$INFO" | awk '{print $3}')
        TOTAL=$(echo "$INFO" | awk '{print $2}')
        USAGE=$(echo "$INFO" | awk '{print $5}' | tr -d '%')
        VALUE="${USED}/${TOTAL}"
        print_line "   Disk $MOUNT" "$VALUE" "$USAGE"
    fi
}

# --- IPs ---
print_ip() {
    IP4=$(ip -4 addr show scope global | grep inet | awk '{print $2}' | cut -d/ -f1 | head -n1)
    IP6=$(ip -6 addr show scope global | grep inet6 | awk '{print $2}' | cut -d/ -f1 | head -n1)
    echo -e "🌐 IPv4 : $IP4\n🌐 IPv6 : $IP6\n"
}

# --- Kernel ---
get_kernel() {
    echo -e "🖧  Kernel : $(uname -r)\n"
}

# --- Vérification undervoltage ---
check_undervoltage() {
    if ! command -v vcgencmd &>/dev/null; then
        echo "ℹ️ vcgencmd non disponible"
        return
    fi
    if [ ! -r /dev/vcio ]; then
        echo "⚠️ Accès à /dev/vcio refusé"
        return
    fi
    THROTTLE=$(vcgencmd get_throttled 2>/dev/null)
    if [[ $THROTTLE != "throttled=0x0" ]]; then
        echo -e "⚠️ Undervoltage / Throttling détecté ($THROTTLE)\n"
    else
        echo -e "✅ Alimentation OK\n"
    fi
}

# --- Utilisateurs connectés ---
print_users() {
    echo -e "👥 Utilisateurs connectés :"
    printf "%-12s | %-10s | %-8s\n" "Utilisateur" "Terminal" "Depuis"
    echo "----------------------------------------"
    who | awk '{printf "%-12s | %-10s | %-8s\n", $1, $2, $5}'
    echo ""
}

# --- Dernier passage ClamAV avec couleur ---
print_clamav_last_run() {
    local mount=$1
    local ts_file="/var/log/clamscan-last-$(basename "$mount").timestamp"
    local color=$GREEN
    local last_run="never"

    if [ -f "$ts_file" ]; then
        last_run=$(cat "$ts_file")
        # Calculer l'âge du scan en heures
        local last_epoch=$(date -d "$last_run" +%s)
        local now_epoch=$(date +%s)
        local age_hours=$(( (now_epoch - last_epoch) / 3600 ))

        if [ "$age_hours" -le 24 ]; then
            color=$GREEN
        elif [ "$age_hours" -le 72 ]; then
            color=$ORANGE
        else
            color=$RED
        fi
    else
        color=$RED
    fi

    printf "   ClamAV last scan on %s : ${color}%s${RESET}\n" "$mount" "$last_run"
}

# --- Rapsberry modèle ---
RASPBERRY_MODEL=$(cat /sys/firmware/devicetree/base/model  | tr -d '\0')

# --- Exécution principale ---
echo -e "${CYAN}===== Dashboard Raspberry Pi (Final) =====${RESET}\n"

echo -e "🍓💻 ${ORANGE} ${RASPBERRY_MODEL} ${RESET}\n"

echo "🖥️  General"
get_temp
get_memory
get_cpu_load
top_processes
get_cpu_uptime
print_users

echo "💽 Disques :"
MOUNTS=("/diskTOTO" "/diskTITA" "/diskTATA" "/")
for MOUNT in "${MOUNTS[@]}"; do
    print_disk_info "$MOUNT"
    print_clamav_last_run "$MOUNT"
done
echo ""

print_ip
get_kernel
check_undervoltage

echo -e "${CYAN}==============================================${RESET}"
Vous avez juste à adapter la section
- download
echo "💽 Disques :"
MOUNTS=("/diskTOTO" "/diskTITA" "/diskTATA" "/")
for MOUNT in "${MOUNTS[@]}"; do
    print_disk_info "$MOUNT"
    print_clamav_last_run "$MOUNT"
done
echo ""
En mettant les disques que vous souhaitez analyser
Commenter la ligne
- download
print_clamav_last_run "$MOUNT"
Si vous n'avez pas installer ça https://cbiot.fr/dokuwiki/clamav